 PluginStats
Debugger for Java installs statistics
By Microsoft (223 listings) · VS Code Marketplace · Programming Languages
A lightweight Java debugger for Visual Studio Code
Debugger for Java has 53,233,591 recorded installs on VS Code Marketplace.
It ranks #23 of 2,500 tracked VS Code Marketplace listings by installs.
It is rated 3.9 out of 5 from 28 ratings.
PluginStats has 3 daily observations since Oct 16, 2026; the latest is from Oct 18, 2026.
Rating: 3.89 / 5 from 28 ratings
About Debugger for Java
Debugger for Java
Overview
A lightweight Java Debugger based on Java Debug Server which extends the Language Support for Java by Red Hat. It allows users to debug Java code using Visual Studio Code (VS Code). Here's a list of features:
• Launch/Attach • Breakpoints/Conditional Breakpoints/Logpoints • Exceptions • Pause & Continue • Step In/Out/Over • Variables • Callstacks • Threads • Debug console • Evaluation • Hot Code Replace • No-Config Debug (debug Java apps without launch.json) • [AI] AI-Assisted Debugging (GitHub Copilot integration)
Requirements
• JDK (version 1.8.0 or later) • VS Code (version 1.19.0 or later) • Language Support for Java by Red Hat (version 0.14.0 or later)
Install
Open VS Code and press F1 or Ctrl + Shift + P to open command palette, select Install Extension and type vscode-java-debug.
Or launch VS Code Quick Open (Ctrl + P), paste the following command, and press enter.
Use
• Launch VS Code • Open a Java project (Maven/Gradle/Eclipse/Single Java file) • Open a Java file to activate the extensions • Press F5
Please also check the documentation of Language Support for Java by Red Hat if you have trouble setting up your project.
No-Config Debug
You can now debug Java applications without creating a launch.json file! Simply open a terminal in VS Code and use the debugjava command:
The debugger will automatically attach. See No-Config Debug Documentation for more details.
No-Config Debug is enabled by default. To disable the terminal integration and the AI debug_java_application tool, set "java.debug.settings.enableNoConfigDebug": false, reload VS Code, and recreate existing terminals. Standard Java launch/attach debugging, including F5 and Run/Debug CodeLens, remains available.
Preparing the terminal integration does not start or wait for the Java language extension. The wrapper uses JAVA_HOME, then VSCODE_JAVA_EXEC when available, then java on PATH. If Java support activates later, recreate an existing terminal to use the newly discovered Java executable.
AI-Assisted Debugging
When using GitHub Copilot Chat, you can now ask AI to help you debug Java applications! The extension provides a Language Model Tool that enables natural language debugging:
• "Debug my Spring Boot application" • "Debug the Main class in this project" • "Debug Calculator with arguments 10 and 5"
The AI will automatically: 1. Detect your project type (Maven/Gradle/VS Code) 2. Build/compile your project 3. Start debugging with appropriate configuration
See Language Model Tool Documentation for more details.
Options
Launch
• mainClass - The fully qualified name of the class containing the main method. If not specified, the debugger automatically resolves the possible main class from current project. • ${file} - Current Java file. • com.mypackage.Main - The fully qualified class name. • com.java9.mymodule/com.mypackage.Main - The fully qualified module name and class name. • /path/to/Main.java - The file path of the main class. • args - The command line arguments passed to the program. • "${command:SpecifyProgramArgs}" - Prompt user for program arguments. • A space-separated string or an array of string. • sourcePaths - The extra source directories of the program. The debugger looks for source code from project settings by default. This option allows the debugger to look for source code in extra directories. • modulePaths - The modulepaths for launching the JVM. If not specified, the debugger will automatically resolve from current project. If multiple values are specified, the debugger will merge them together. • $Auto - Automatically resolve the modulepaths of current project. • $Runtime - The modulepaths within 'runtime' scope of current project. • $Test - The modulepaths within 'test' scope of current project. • !/path/to/exclude - Exclude the specified path from modulepaths. • /path/to/append - Append the specified path to the modulepaths. • classPaths - The classpaths for launching the JVM. If not specified, the debugger will automatically resolve from current project. If multiple values are specified, the debugger will merge them together. • $Auto - Automatically resolve the classpaths of current project. • $Runtime - The classpaths within 'runtime' scope of current project. • $Test - The classpaths within 'test' scope of current project. • !/path/to/exclude - Exclude the specified path from classpaths. • /path/to/append - Append the specified path to the classpaths. • encoding - The file.encoding setting for the JVM. Possible values can be found in https://docs.oracle.com/javase/8/docs/technotes/guides/intl/encoding.doc.html. • vmArgs - The extra options and system properties for the JVM (e.g. -Xms\ -Xmx\ -D\=\), it accepts a string or an array of string. • projectName - The preferred project in which the debugger searches for classes. There could be duplicated class names in different projects. This setting also works when the debugger looks for the specified main class when launching a program. It is required when the workspace has multiple java projects, otherwise the expression evaluation and conditional breakpoint may not work. • cwd - The working directory of the program. Defaults to ${workspaceFolder}. • env - The extra environment variables for the program. • envFile - Absolute path to a file containing environment variable definitions. Multiple files can be specified by providing an array of absolute paths • stopOnEntry - Automatically pause the program after launching. • console - The specified console to launch the program. If not specified, use the console specified by the java.debug.settings.console user setting. • internalConsole - VS Code debug console (input stream not supported). • integratedTerminal - VS Code integrated terminal. • externalTerminal - External terminal that can be configured in user settings. • shortenCommandLine - When the project has long classpath or big VM arguments, the command line to launch the program may exceed the…
Description from the VS Code Marketplace listing.
- debug
- debugger
- debuggers
- debugging
- java
- language-model-tools
- tools
Where Debugger for Java sits in the listing
Each band is one page of 20. Installs on a log scale. Placement is projected from installs, so it can differ from the marketplace's own sort order. Hover a dot to see the listing.


Charts
Images: 30d · 1y · all time · 1600×900 dark


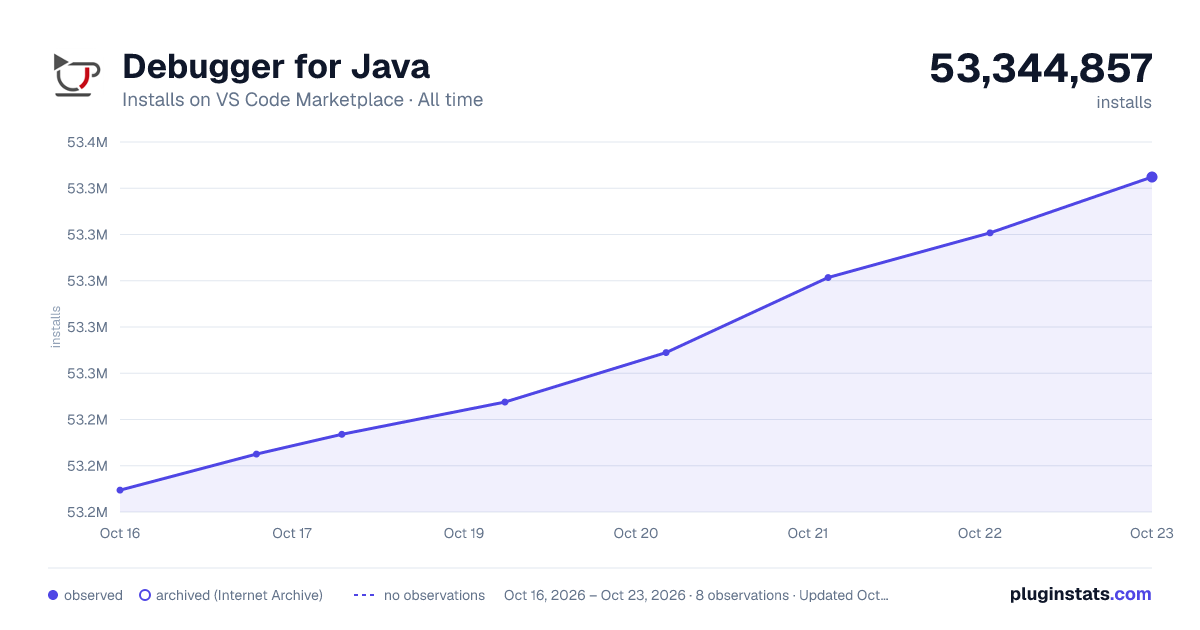

Adoption over time


7/30/90-day growth


Ranking history


Filled points are observed values; hollow points come from Internet Archive snapshots of the listing page. Dashed segments span periods with no observations — values between points are not interpolated.
Recent observations
Full history (3)Similar VS Code Marketplace Programming Languages plugins
Data source
Install counts, average rating, and rating counts come from the public Visual Studio Marketplace gallery API. Installs are cumulative and exclude updates.
Listing: https://marketplace.visualstudio.com/items?itemName=vscjava.vscode-java-debug. First seen Oct 16, 2026; last successful collection Oct 18, 2026. See the methodology.