 PluginStats

ChartingView - US Stock Tracker - Live Prices, Watchlist, Badge Alerts users statistics
Track live US stock prices in your Chrome toolbar badge with a watchlist, charts, extended-hours quotes, and price alerts.
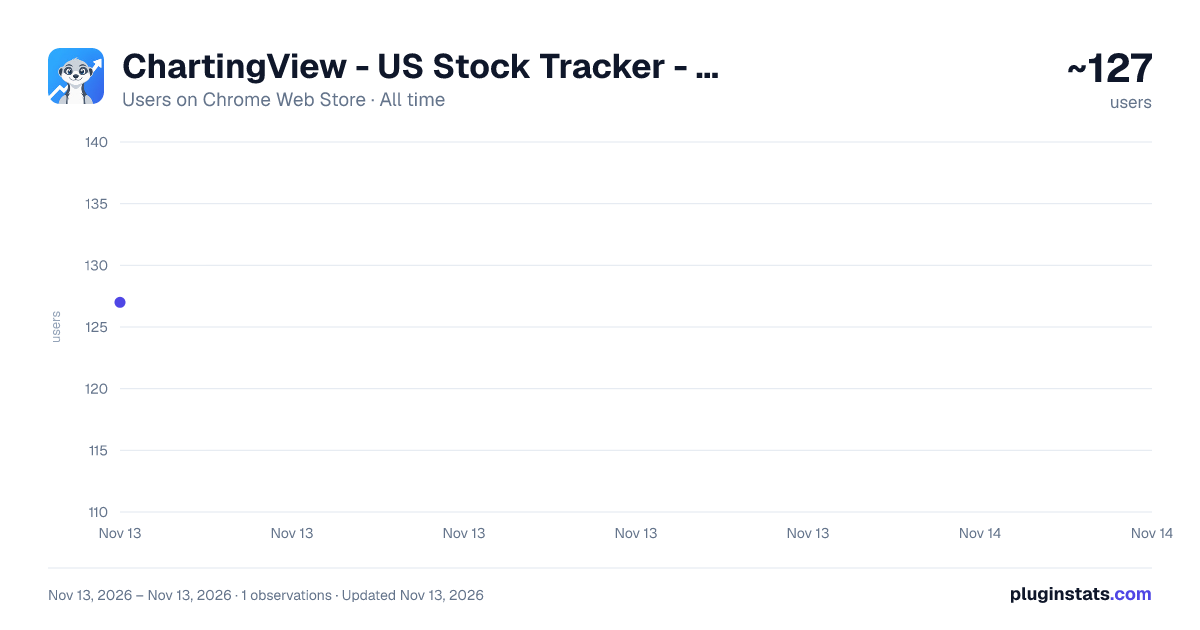
ChartingView - US Stock Tracker - Live Prices, Watchlist, Badge Alerts has approximately 127 recorded users on Chrome Web Store, ranking #9355 of 10,388 tracked listings.
Rating: 5.00 / 5 from 1 ratings
About ChartingView - US Stock Tracker - Live Prices, Watchlist, Badge Alerts
Track live US stock prices in your Chrome toolbar badge with a watchlist, charts, extended-hours quotes, and price alerts.
ChartingView - US Stock Tracker puts live US stock prices on your Chrome toolbar badge, with a stock watchlist, intraday and daily candlestick charts, pre-market and after-hours quotes, price alerts, stock news, and an economic calendar, all without leaving the page you are on.
It is a fast, lightweight stock ticker extension for investors and traders who want to watch US stocks, ETFs, gold, the VIX, and major market indexes while working, studying, or browsing.
Key features • Stock watchlist: Search a US stock ticker or company name, then add, remove, and reorder the stocks and ETFs you follow. • Live toolbar badge: Show the latest price or daily percentage change of a primary ticker on the extension icon, auto-rotate through every ticker in your watchlist, and give each stock its own badge color. • Popup, side panel, and full page: Check quotes in a compact popup, keep a side panel open for continuous tracking, or open a full-page watchlist. • Stock charts: Review intraday and daily candlestick charts with open, previous close, high, and low, plus today's range and the 30-day range. • Extended-hours quotes: Follow pre-market, regular, after-hours, and overnight sessions with a clear market status. • Market overview: See the S&P 500, Nasdaq 100, and Dow through the SPY, QQQ, and DIA ETFs, with optional 10-year Treasury nominal and real yields. • Price alerts: Set target-price alerts, daily percentage-change alerts, and short-window move alerts (for example, up 0.4% within 3 minutes). Choose regular or extended sessions and how often each alert can fire, then receive desktop notifications, email, or webhook messages. • Trading halt and earnings reminders: Get notified when a watched stock is halted or resumes trading, and a couple of days before it reports earnings. • Stock news and earnings dates: Read related news for each ticker, general market news, and upcoming earnings dates. • Economic calendar: Filter FOMC, inflation, employment, and other events by impact and type, switch between list and calendar views, show your local time, and get reminders before high-impact events. • Page top ticker banner: Show a scrolling or flipping quote bar at the top of webpages, with a site blacklist or whitelist. • Backup and restore: Export your watchlist, alerts, and settings to a JSON file and import them again later. • Personal settings: Choose US-style (green up) or alternative (red up) price colors, the interface language, what the toolbar icon opens, and which quote website opens from a ticker.
Why install ChartingView? Finance websites can be crowded, and switching tabs to check a quote interrupts your work. ChartingView keeps your watchlist, price moves, alerts, and market events one glance away on the Chrome toolbar, so you can spot important changes with fewer steps.
Privacy and market-data notice Your watchlist, alert settings, and preferences are stored in your browser. Email and webhook alerts are optional; when you turn them on, your alert rules and delivery address are sent to the alert service only to deliver those notifications. The extension does not provide investment advice or place trades. Market data can be delayed or change quickly, so verify important information with a trusted source before making financial decisions.
Description from the Chrome Web Store listing.
README badge
Show your rank in a README or on your website. The badge updates automatically.
Charts
Images: 30d · 1y · all time · 1600×900 dark
Adoption over time
7/30/90-day growth
Ranking history
Ratings over time
Listing placement
Listing placement
Filled points are observed values; hollow points come from Internet Archive snapshots of the listing page. Dashed segments span periods with no observations — values between points are not interpolated.
Each band is one page of 20. Users on a linear scale. Placement is projected from users, so it can differ from the marketplace's own sort order. Hover a dot to see the listing.
Recent observations
Full history (1)Similar Chrome Web Store Tools plugins
All 20 ChartingView - US Stock Tracker - Live Prices, Watchlist, Badge Alerts alternatives



Data source
Covers every Chrome Web Store extension with at least 100 users, found through the store's public sitemap. User counts are read from public listing pages. The 10% most-used extensions are refreshed daily, the next 40% weekly and the next 40% monthly; the least-used 10% are not refreshed. Google displays rounded user counts (and caps the display at 10,000,000+), so small changes may not be visible. Rating counts above 1,000 are rounded (e.g. 1.6K).
Listing: https://chromewebstore.google.com/detail/chartingview-us-stock-tra/hhlhogmjmiebkkinjffngckmiaeocbnb. First seen Nov 13, 2026; last successful collection Nov 13, 2026. See the methodology.