 PluginStats

Stock Checkup Flaw Counter users statistics
Chrome Web Store · Workflow & Planning
Counts the number of Stock Checkup Flaws at https://research.investors.com/stock-checkup.
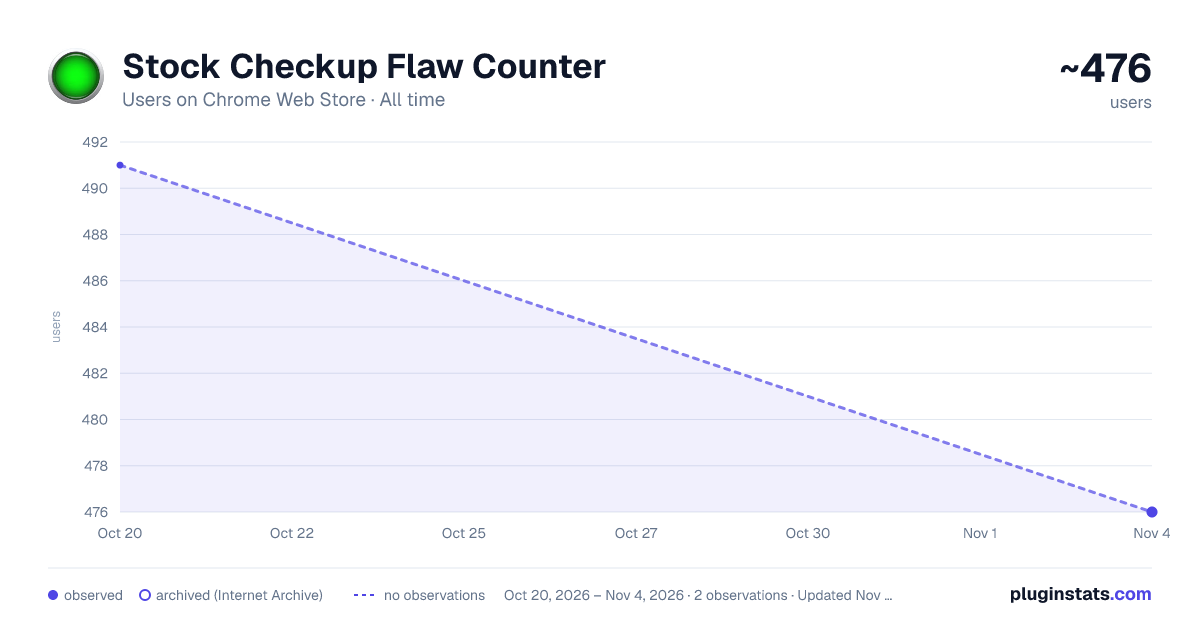
Stock Checkup Flaw Counter has approximately 491 recorded users on Chrome Web Store, ranking #1719 of 3,404 tracked listings.
Rating: 5.00 / 5 from 7 ratings
About Stock Checkup Flaw Counter
Counts the number of Stock Checkup Flaws at https://research.investors.com/stock-checkup.
Save time when trying to count Stock Checkup flaws on investors.com. This extension counts the flaws (according to common IBD Meetup rules) and assigns a letter grade. Also calculates ROE (return on equity) plus PTM (pre-tax margin), and calculates the average daily liquidity (average daily dollar volume proxy). Put your calculator and notepad away!
NEW: Calculates share turnover % (50-day Avg Volume / shares available). On /stock-checkup page, shows turnover of shares outstanding. On /stock-quotes page, also shows turnover of float. The arrow next to Turnover on the /stock-checkup page shows the Up/Down Volume ratio
Also adds a rudimentary EPS trend chart, so you can see at a glance if earnings may be decelerating.
For more info on these scoring tools, please visit the Petaluma Investor's Business Daily Meetup site: https://sites.google.com/view/petalumaibdmeetup
This tool is for educational purposes only, and not intended to recommend any security. Use at your own risk! We are not responsible for errors or omissions. This is not to be construed as investment advice, and we are not investment advisors.
Browser extension development is supported by user donations. If you find this extension useful, please consider sending a commensurate donation to support our developers, via this url: https://www.paypal.com/donate?hosted_button_id=VYB6ZVDTU4KEG
FAQ:
- "Why is the EPS Trend chart blank for some stocks?"
Good question. The answer is that some stocks have an "N/A" for either 3Yr EPS, 3Qtr EPS or last EPS. Without 3Y, 3Q, & 1Q, no trend can be drawn. If the EPS Trend chart is blank, that means not enough data are available to determine a trend.
If you see a very small gap at the righthand end of the chart, that means there is no current estimate.
Description from the Chrome Web Store listing.
README badge
Show your rank in a README or on your website. The badge updates automatically.
Charts
Images: 30d · 1y · all time · 1600×900 dark
Adoption over time
7/30/90-day growth
Ranking history
Ratings over time
Listing placement
Listing placement
Filled points are observed values; hollow points come from Internet Archive snapshots of the listing page. Dashed segments span periods with no observations — values between points are not interpolated.
Each band is one page of 20. Users on a linear scale. Placement is projected from users, so it can differ from the marketplace's own sort order. Hover a dot to see the listing.
Recent observations
Full history (1)Similar Chrome Web Store Workflow & Planning plugins
All 20 Stock Checkup Flaw Counter alternatives



Data source
Covers every Chrome Web Store extension with at least 100 users, found through the store's public sitemap. User counts are read from public listing pages. The 10% most-used extensions are refreshed daily, the next 40% weekly and the next 40% monthly; the least-used 10% are not refreshed. Google displays rounded user counts (and caps the display at 10,000,000+), so small changes may not be visible. Rating counts above 1,000 are rounded (e.g. 1.6K).
Listing: https://chromewebstore.google.com/detail/stock-checkup-flaw-counte/hjjmcblclhoojiebngknemobljbjocdi. First seen Oct 20, 2026; last successful collection Oct 20, 2026. See the methodology.