 PluginStats
State Backed Machine Visualizer installs statistics
By State Backed · GitHub Marketplace
Add PR comments visualizing added or changed XState state machines
State Backed Machine Visualizer has 22 recorded installs on GitHub Marketplace, ranking #859 of 1,411 tracked listings.
About State Backed Machine Visualizer
The State Backed state machine visualizer will add a comment to any PR that adds or changes an XState state machine with a visualization of the machine.
Keep authors, reviewers, and maintainers on the same page by visualizing the structure of your logic.
Made with ❤️ by State Backed, the fastest way to deploy state machines as invincible workflows and real-time backends.
This GitHub bot is actually running on State Backed :)
Install the State Backed state machine visualizer on as many repositories as you like.
The bot will ignore PRs that don't include a state machine.
For PRs that do include a state machine, the bot will add a comment to the createMachine call with visualization of the machine (because of the limitations of GitHub comments, this is a static SVG).
The visualization is created with the @statebacked/react-statechart library.
This bot is running on State Backed. For each GitHub webhook, we extract the entities involved (e.g. users, repositories, pull requests) and then send the webhook as an event to the state machine that represents that entity. The actual implementation is just a simple state machine, reacting to events and executing a durable workflow.
Description from the GitHub Marketplace listing.
- Code review
- Utilities
README badge
Show your rank in a README or on your website. The badge updates automatically.
Charts
Images: 30d · 1y · all time · 1600×900 dark


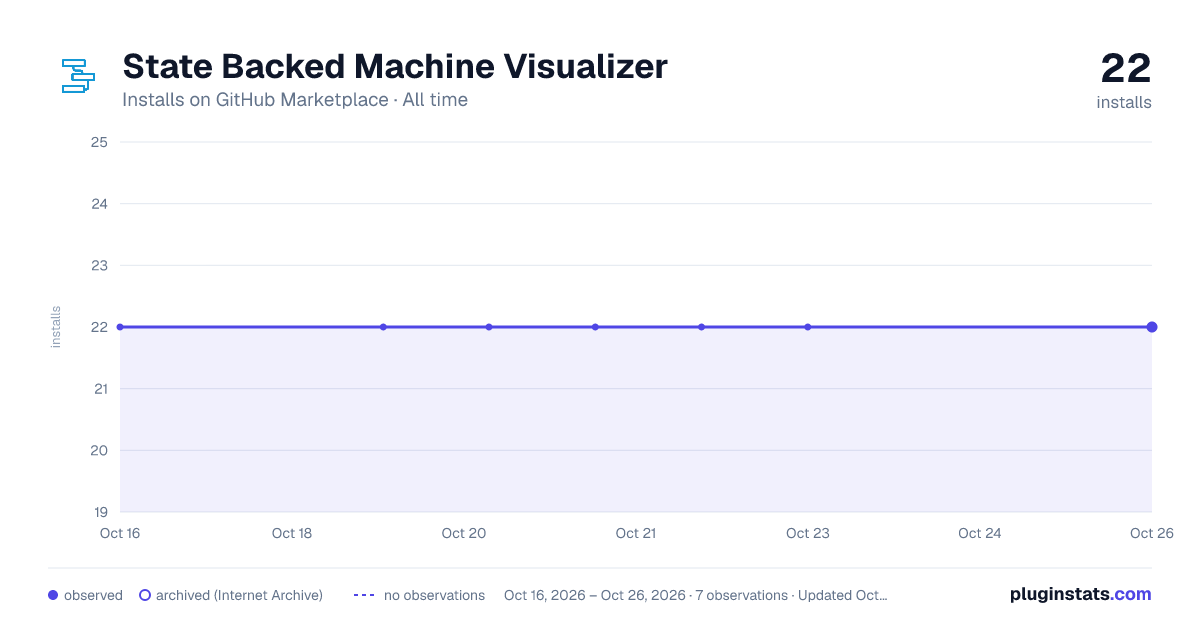

Adoption over time
7/30/90-day growth
Ranking history
Listing placement
Filled points are observed values; hollow points come from Internet Archive snapshots of the listing page. Dashed segments span periods with no observations — values between points are not interpolated.
Each band is one page of 20. Installs on a linear scale. Placement is projected from installs, so it can differ from the marketplace's own sort order. Hover a dot to see the listing.
Recent observations
Full history (3)Similar GitHub Marketplace plugins
All 20 State Backed Machine Visualizer alternativesData source
Install counts (installations of each GitHub App across accounts and organizations) are read from public GitHub Marketplace listing pages. GitHub does not publish ratings. Category positions reflect GitHub's own popularity sort.
Listing: https://github.com/marketplace/state-backed-machine-visualizer. First seen Oct 16, 2026; last successful collection Oct 20, 2026. See the methodology.