 PluginStats
Uplevel for GitHub installs statistics
By UplevelTeam · GitHub Marketplace
Connect GitHub data to measure what drives delivery: team dynamics, workflow friction, environment efficiency, and AI impact
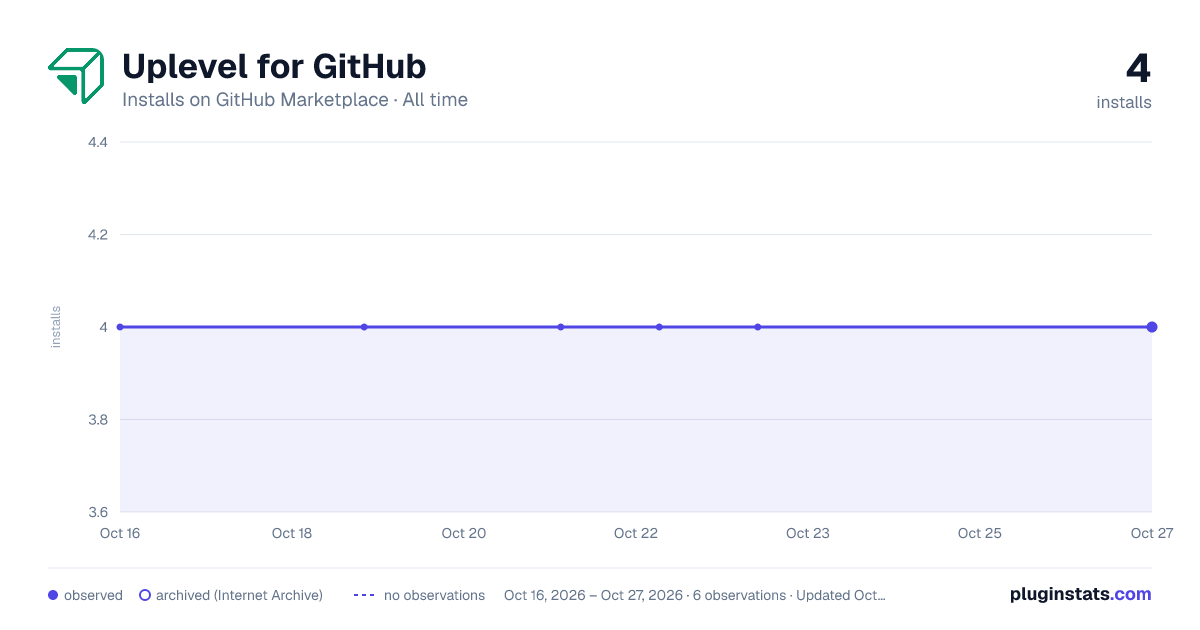
Uplevel for GitHub has 4 recorded installs on GitHub Marketplace.
It ranks #1174 of 1,393 tracked GitHub Marketplace listings by installs.
PluginStats has 1 daily observations since Oct 16, 2026; the latest is from Oct 16, 2026.
About Uplevel for GitHub
GitHub Copilot generates code faster, but does that speed reach production? Uplevel combines GitHub data with qualitative signals from calendar, chat, surveys, and more to illuminate your entire SDLC. From code generation to deployment, Uplevel reveals where bottlenecks prevent you from getting full value from AI. Get the evidence you need to optimize your delivery pipeline, justify infrastructure improvements, and answer executives asking if the AI spend is paying off.
Engineering leaders need more than commit counts and PR metrics in the age of AI. Uplevel analyzes GitHub activity alongside product management and CI/CD data and team collaboration patterns to reveal where work actually slows down: code review wait times, CI/CD pipeline bottlenecks, testing delays, deployment friction. These constraints limit how much speed you can extract from AI-accelerated development — and identifying them is the first step to removing them.
Maximize your AI tool investment
AI coding assistants like GitHub Copilot work. The question is whether your delivery pipeline is ready to handle the increased throughput. Uplevel shows you:
• The impact of AI usage on velocity and quality metrics • Where AI-generated code gets delayed • Which infrastructure investments will unlock the greatest productivity gains • Whether workflow changes actually improve delivery speed
Uplevel’s sociotechnical WAVE Framework organizes insights around what actually matters for delivery:
• Ways of Working: Collaboration patterns and deep work • Alignment: Whether engineering work maps to business priorities • Velocity: Actual delivery pace and DORA metrics, not just commit volume • Environment Efficiency: Build times, pipeline performance, tooling friction
What you'll see
• Complete flow from commit to production, with timing at each stage • Code review patterns and wait times • CI/CD pipeline performance and deployment frequency • Workflow bottlenecks before/after AI tool adoption • Where faster code generation reveals capacity constraints
Justify your next budget ask: Use Uplevel data to prove that your investment request isn't "nice to have" — it's the constraint preventing AI tools from delivering their full value. Show executives that fixing the deployment pipeline will unlock the productivity they already paid for.
Description from the GitHub Marketplace listing.
- Reporting
- Utilities
Where Uplevel for GitHub sits in the listing
Each band is one page of 20. Installs on a log scale. Placement is projected from installs, so it can differ from the marketplace's own sort order. Hover a dot to see the listing.


Charts
Images: 30d · 1y · all time · 1600×900 dark



Adoption over time


7/30/90-day growth


Filled points are observed values; hollow points come from Internet Archive snapshots of the listing page. Dashed segments span periods with no observations — values between points are not interpolated.
Recent observations
Full history (1)Similar GitHub Marketplace plugins
Data source
Install counts (installations of each GitHub App across accounts and organizations) are read from public GitHub Marketplace listing pages. GitHub does not publish ratings. Category positions reflect GitHub's own popularity sort.
Listing: https://github.com/marketplace/uplevel-for-github. First seen Oct 16, 2026; last successful collection Oct 16, 2026. See the methodology.