 PluginStats
AgentMeter installs statistics
By AgentMeter · GitHub Marketplace
Know what every AI agent run costs — right in your PR
AgentMeter has 12 recorded installs on GitHub Marketplace.
It ranks #988 of 1,393 tracked GitHub Marketplace listings by installs.
PluginStats has 1 daily observations since Oct 16, 2026; the latest is from Oct 16, 2026.
About AgentMeter
AgentMeter tracks token usage and cost for every AI agent run in GitHub Actions — and posts a cost summary directly on the pull request.
Works with Claude Code, Codex, Cursor, and GitHub Agentic Workflows.
No infrastructure. No config files. Three lines of YAML.
• Per-run cost broken down by input, output, and cache tokens • Full run history and spend trends at agentmeter.app • Free for individual repos — Pro for teams
What is AgentMeter?
AgentMeter gives developers and teams full visibility into AI agent runs — what triggered each run, what it cost, and whether it succeeded.
Every time an agent workflow completes, AgentMeter records token counts, calculates cost, and posts a summary on the triggering PR or issue. All runs are available in the dashboard at agentmeter.app.
Features
Cost tracking per run — broken down by input, output, cache read, and cache write tokens.
PR and issue comments — cost summary posted automatically on the triggering PR or issue.
Run history dashboard — filter by repo, engine, and status. Sort by cost or time.
Spend trends — track usage over time. Spot expensive weeks before they hit your API bill.
Team support — invite members to share visibility across the org.
How it works
• Install the GitHub App • Add the Action — three lines of YAML at the end of your agent workflow • AgentMeter records every run, calculates cost, and posts a PR comment automatically
Pricing
Free — 1 repo, 30-day retention, full run history, PR comments
Pro ($19/month) — unlimited repos, 90-day retention, trends, budget alerts, team members
Full docs at github.com/agentmeter/agentmeter-action
Description from the GitHub Marketplace listing.
- Monitoring
- Reporting
Where AgentMeter sits in the listing
Each band is one page of 20. Installs on a log scale. Placement is projected from installs, so it can differ from the marketplace's own sort order. Hover a dot to see the listing.


Charts
Images: 30d · 1y · all time · 1600×900 dark


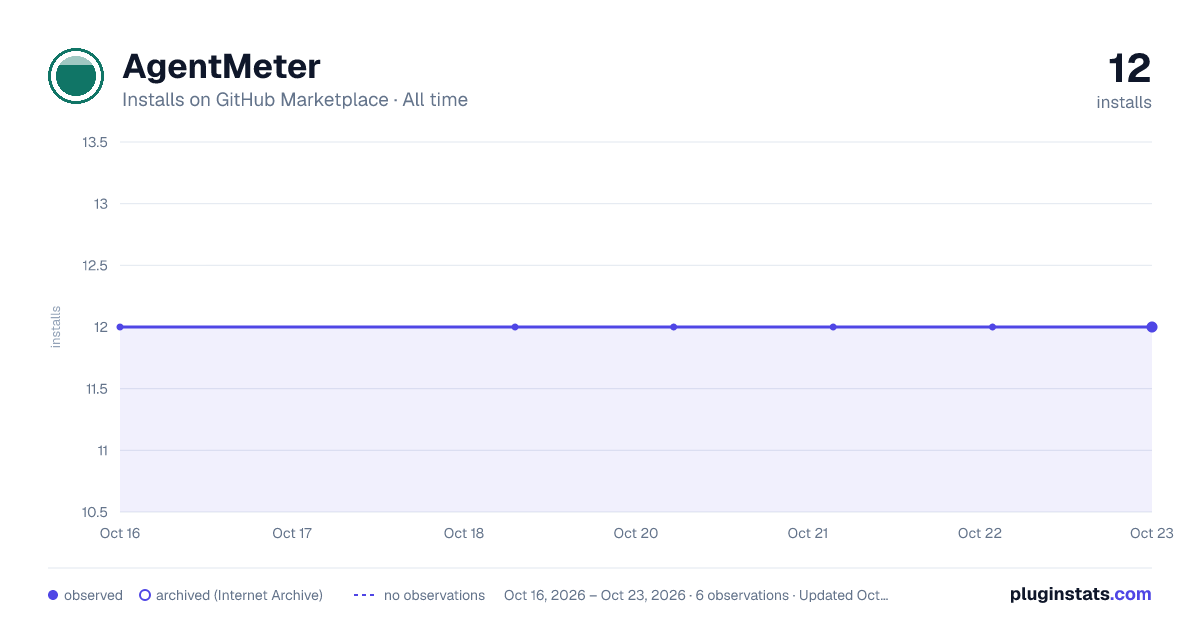

Adoption over time


7/30/90-day growth


Filled points are observed values; hollow points come from Internet Archive snapshots of the listing page. Dashed segments span periods with no observations — values between points are not interpolated.
Recent observations
Full history (1)Similar GitHub Marketplace plugins
Data source
Install counts (installations of each GitHub App across accounts and organizations) are read from public GitHub Marketplace listing pages. GitHub does not publish ratings. Category positions reflect GitHub's own popularity sort.
Listing: https://github.com/marketplace/agentmeter. First seen Oct 16, 2026; last successful collection Oct 16, 2026. See the methodology.