 PluginStats
Grafana MCP installs statistics
By Grafana Labs (107 listings) · Claude Plugins · Claude Code
MCP server for AI-assisted Grafana dashboard, datasource, alerting, and incident management.
Grafana MCP has 821 recorded installs on Claude Plugins, ranking #198 of 341 tracked listings.
About Grafana MCP
Connects Claude Code to a live Grafana instance via the official Grafana MCP server, adding 40+ tools for AI-assisted observability workflows. Manage dashboards, datasources, alerting rules, incidents, and on-call schedules directly from your editor. Query Prometheus metrics and Loki logs, create and patch dashboards, manage contact points, and deep-link to specific panels — all through natural language.
The plugin runs the official grafana/mcp-grafana Docker image and covers nine major tool categories: Dashboards (search, summarize, patch), Datasources (list, retrieve), Prometheus (query execution, metric exploration), Loki (log and metric analysis), Alerting (rule and contact point management), Incidents (creation and activity tracking), OnCall (schedule and shift visibility), Navigation (deep linking), and Annotations (CRUD and tag management).
Requires Docker and a Grafana service account token. Viewer role provides read access; Editor role enables write operations. Works with both self-hosted Grafana and Grafana Cloud instances.
How to use: After installing and configuring your Grafana URL and service account token, try prompts like: "Show me all dashboards related to API latency", "Query Prometheus for the p99 request duration over the last hour", "Create an alert rule for when error rate exceeds 5%", "Search Loki logs for errors in the auth service", or "List all active incidents and their current status".
Description from the Claude Plugins listing.
README badge
Show your rank in a README or on your website. The badge updates automatically.
Charts
Images: 30d · 1y · all time · 1600×900 dark


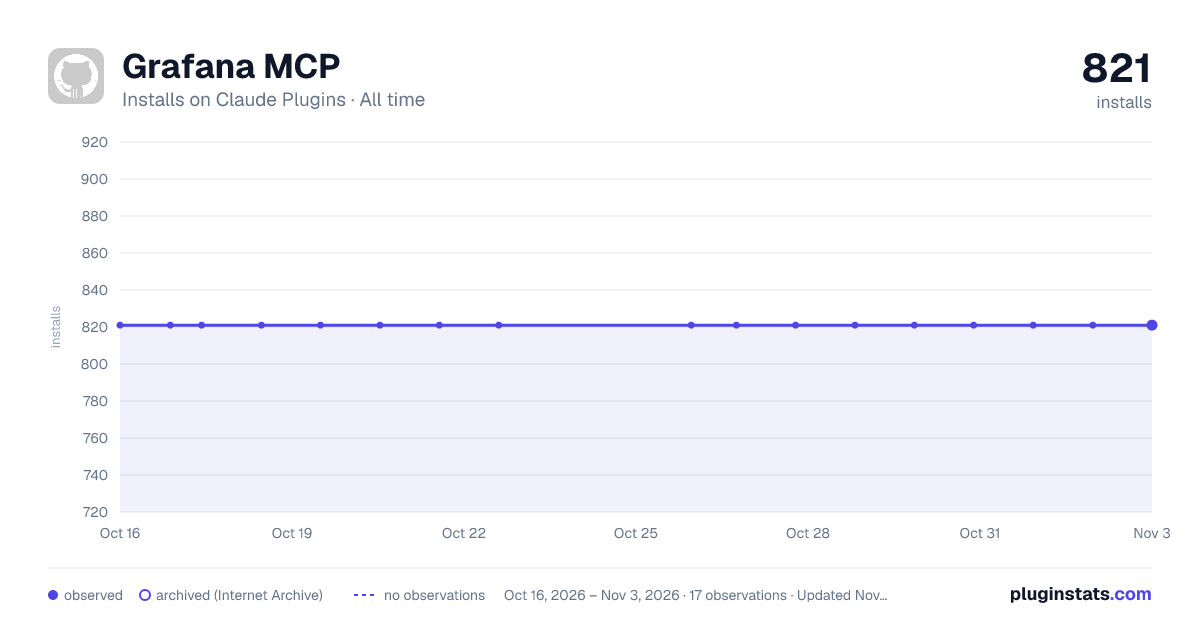

Adoption over time
7/30/90-day growth
Ranking history
Listing placement
Filled points are observed values; hollow points come from Internet Archive snapshots of the listing page. Dashed segments span periods with no observations — values between points are not interpolated.
Each band is one page of 20. Installs on a linear scale. Placement is projected from installs, so it can differ from the marketplace's own sort order. Hover a dot to see the listing.
Recent observations
Full history (5)Similar Claude Plugins Claude Code plugins
All 20 Grafana MCP alternativesData source
Exact install counts are published on the official Claude plugin directory. Ratings and categories are not published. Historical values before tracking began come from Internet Archive snapshots.
Listing: https://claude.com/marketplace/plugins/grafana-mcp. First seen Oct 16, 2026; last successful collection Oct 20, 2026. See the methodology.